Four Most Important Equations
Interactions Article (Part I, Part II)
Nunn Resp Physiology
the effects of deadspace on CO2 are ameliorated by an increase in minute volume, unless pt can’t spont breathe
~35-40% fiO2 will eliminate deadspace effects on O2
Alveolar deadspace in our patients is often caused by decreased lung perfusion
at decreased temperatures, CO2 becomes more soluble
Deadspace Review
(Inten Care Med 2011;37:735)
Alveolar Ventilation for Oxygenation
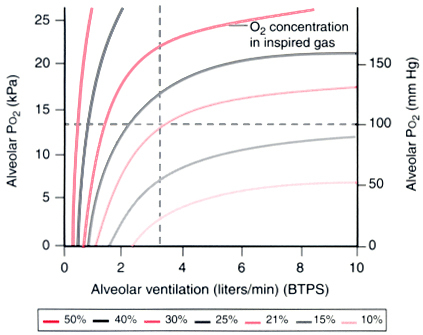

Figure 17-24 For any given O2 concentration in inspired gas, the relationship between alveolar ventilation and Pao2 is hyperbolic. As the inspired O 2 concentration is increased, the amount that alveolar ventilation must decrease to produce hypoxemia is greatly increased. BTPS, body temperature, ambient pressure, saturated. (Redrawn from Lumb AB: Respiratory system resistance: Measurement of closing capacity. In Lumb AB [ed]: Nunn’s Applied Respiratory Physiology, 5th ed. London, Butterworths, 2000, p 79.) (From Miller’s Anesthesia)
Andrew Farmery writes: It’s just the alveolar gas equation plotted out. i.e. it’s simply PA=FI x (PB-PH2O) – (PB x vO2/VA).
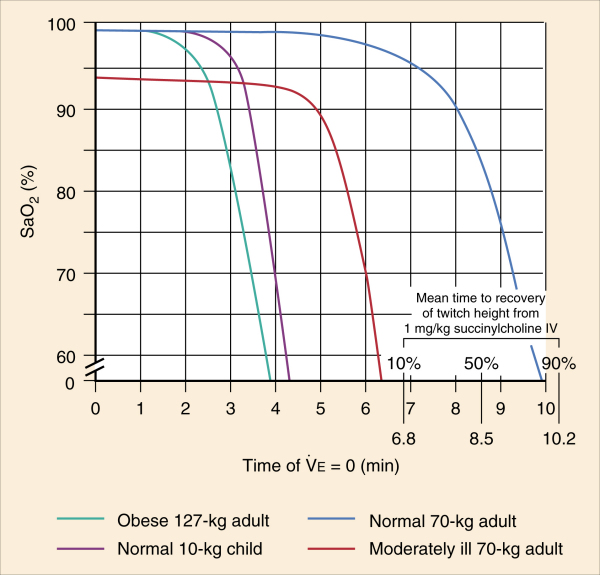
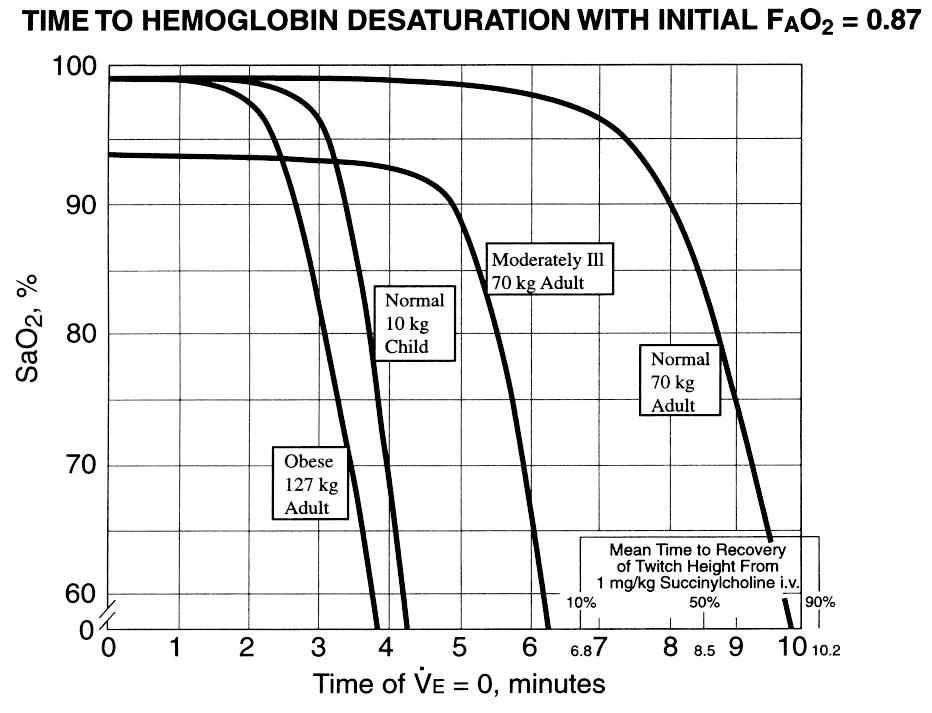
Apneic Oxygenation (Anesthesiology 1959;Nov/Dec:789)
Desaturation Time with Preox and Occluded Airway
Simulator of the effect of supp. oxygen on detecting hypoventilation
David Story finally put into the literature something I have been wrestling with forever. The PaCO2 in the Alveolar Gas Equation is simply there to represent alveolar ventilation, it doesn’t imply PaCO2 affects PaO2/PAO2.
Deadspace
Mask adds 82 cc of deadspace compared to tube, even though it is actually 125 cc more space (BR J Anesth 1969;41:94)
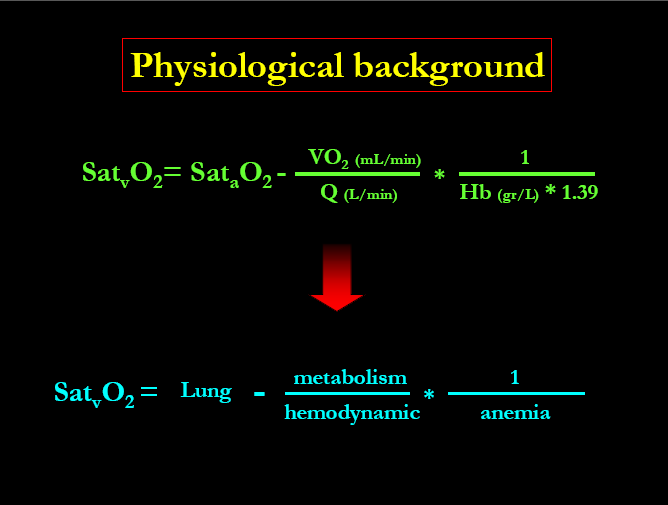
What determines Venous Saturation
Alveolar Ventilation for CO2
J Clin Anesth. 1989;1(5):328-32. Links Comment in: J Clin Anesth. 1989;1(5):323-7. J Clin Anesth. 1991 Jan-Feb;3(1):82-4. The PaCO2 rate of rise in anesthetized patients with airway obstruction. Stock MC, Schisler JQ, McSweeney TD. Department of Anesthesiology, Emory University School of Medicine, Atlanta, GA. Apneic, anesthetized patients frequently develop airway obstruction or may be disconnected from ventilatory support. The rate of PaCO2 rise is usually assumed to be equal to that of anesthetized humans who are receiving apneic oxygenation. Apneic oxygenation may eliminate CO2 because it requires a continuous O2 flow. The CO2 rate of rise in anesthetized humans with airway obstruction was measured. Fourteen consenting healthy adults were monitored continuously with pulse oximetry and EKG. Enflurane–O2 anesthesia was established for at least 10 minutes with normal PaCO2 without neuromuscular blockade so that anesthesia was deep enough to prevent spontaneous ventilation. Then, patients’ tracheal tubes were clamped. Arterial blood samples were obtained before and after 0, 20, 40, 60, 120, 180, 240, and 300 seconds after clamping, provided that oxyhemoglobin saturation exceeded 0.92. The equation that best described the PaCO2 rise was a logarithmic function. Piecewise linear approximation yielded a PaCO2 increase of 12 mmHg during the first minute of apnea, and 3.4 mmHg/minute thereafter. These values should be employed when estimating the duration of apnea from PaCO2 change for anesthetized patients who lack ventilatory support. In addition, it appears that the flows of O2 that most earlier investigators used when delivering apneic oxygenation probably did not eliminate significant CO2 quantities.
PaCO2=VCO2 (production) / (VE x (1- Vd/Vt)
VE=minute ventilation Vd=deadspace Vt=tidal volume
Bohr Equation Vd/Vt=(PaCO2-PetCO2)/PaCO2
Normal=0.2-0.4
Spontaneous breathing patients will breathe at a PaCO2 of 50; with preoxygenation, it is a PaCO2 of 60
In an apneic anesthetized patient the rate of CO2 rise
12 mmHg in the 1st minute
3.5 mmHg per minute thereafter
(Anesthesiology 1961;22:419, J Clin Anesth 1989;1:328)
Hypercapnea
VT=VA+VD (Alveolar/Deadspace)
PaCO2=PACO2 in normal lungs
Increased CO2 production (hypermetabolic states)
Decreased Alveolar ventilation/Increased deadspace ventilation
Decreased Tidal Volume
Aa Gradient
8+Age/5 is normal
How mixed venous changes screws this stuff up
Hypoxemia
Type I-hypoxemic, PaO2<60
Type II-hypercapneic w/wo hypoxemia, PaCO2>50
Mechanisms of Hypoxemia
- Inadequate PAO2
- Alveolar Hypoventilation
- Decreased FiO2/Increased Altitude
- V/Q Mismatch
- Shunt (Will not improve with O2)
- Intrapulmonary (Pneumonia, ARDS)
- Intracardiac
- Intravascular
- Diffusion Abnormality
- Low SvO2
PAO2=FiO2(PB-PH2O) – PaCO2/R
R=.8
Reabsorbtion atelectasis and loss of hypoxic pulmonary vasoconstriction may actually cause hypoxemia to get worse in the presence of high fiO2 and shunt.
article on the mechanisms of hypoxemia (intensive care medicine 2005;31:1017-1019)
Decreased PaO2 can actually lower respiratory drive in the critically ill, studies done in patients with cardiogenic shock.
Primary neurologic problems can result in decreased respiratory drive. these include AML, spinal cord injuries, guillain-barre, and muscular disorders.
Respiratory muscle fatigue from COPD/Asthma, ARDS, etc.
Increased production in sepsis, hypothermia, salicilates,
Increased deadspace ventilation
Hypercapnia can decrease respiratory drive.
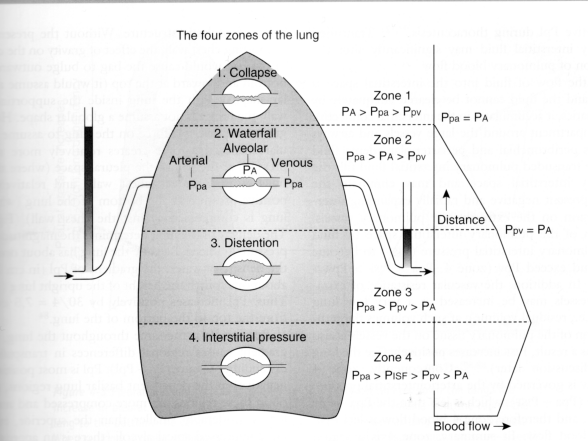
West Zones
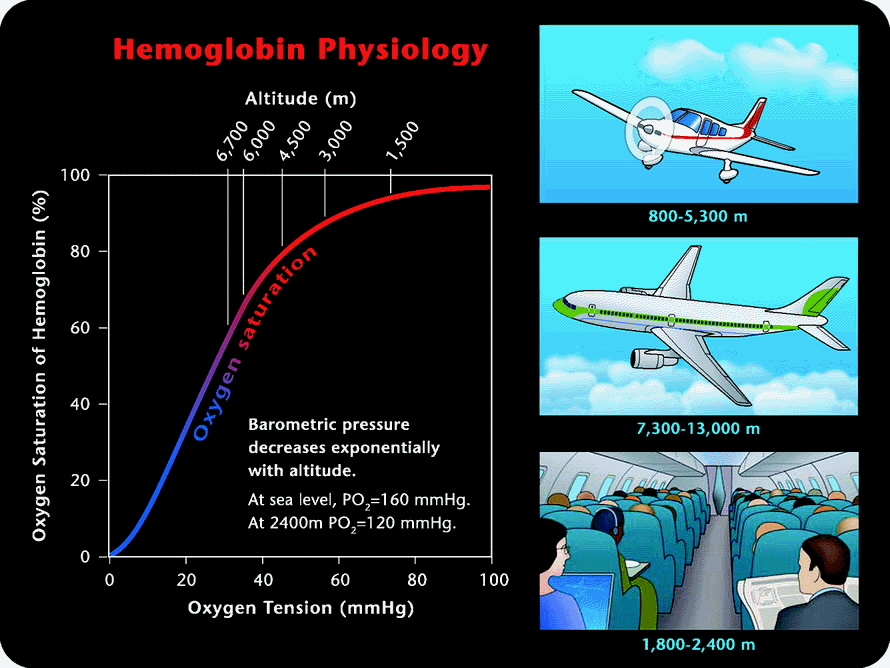
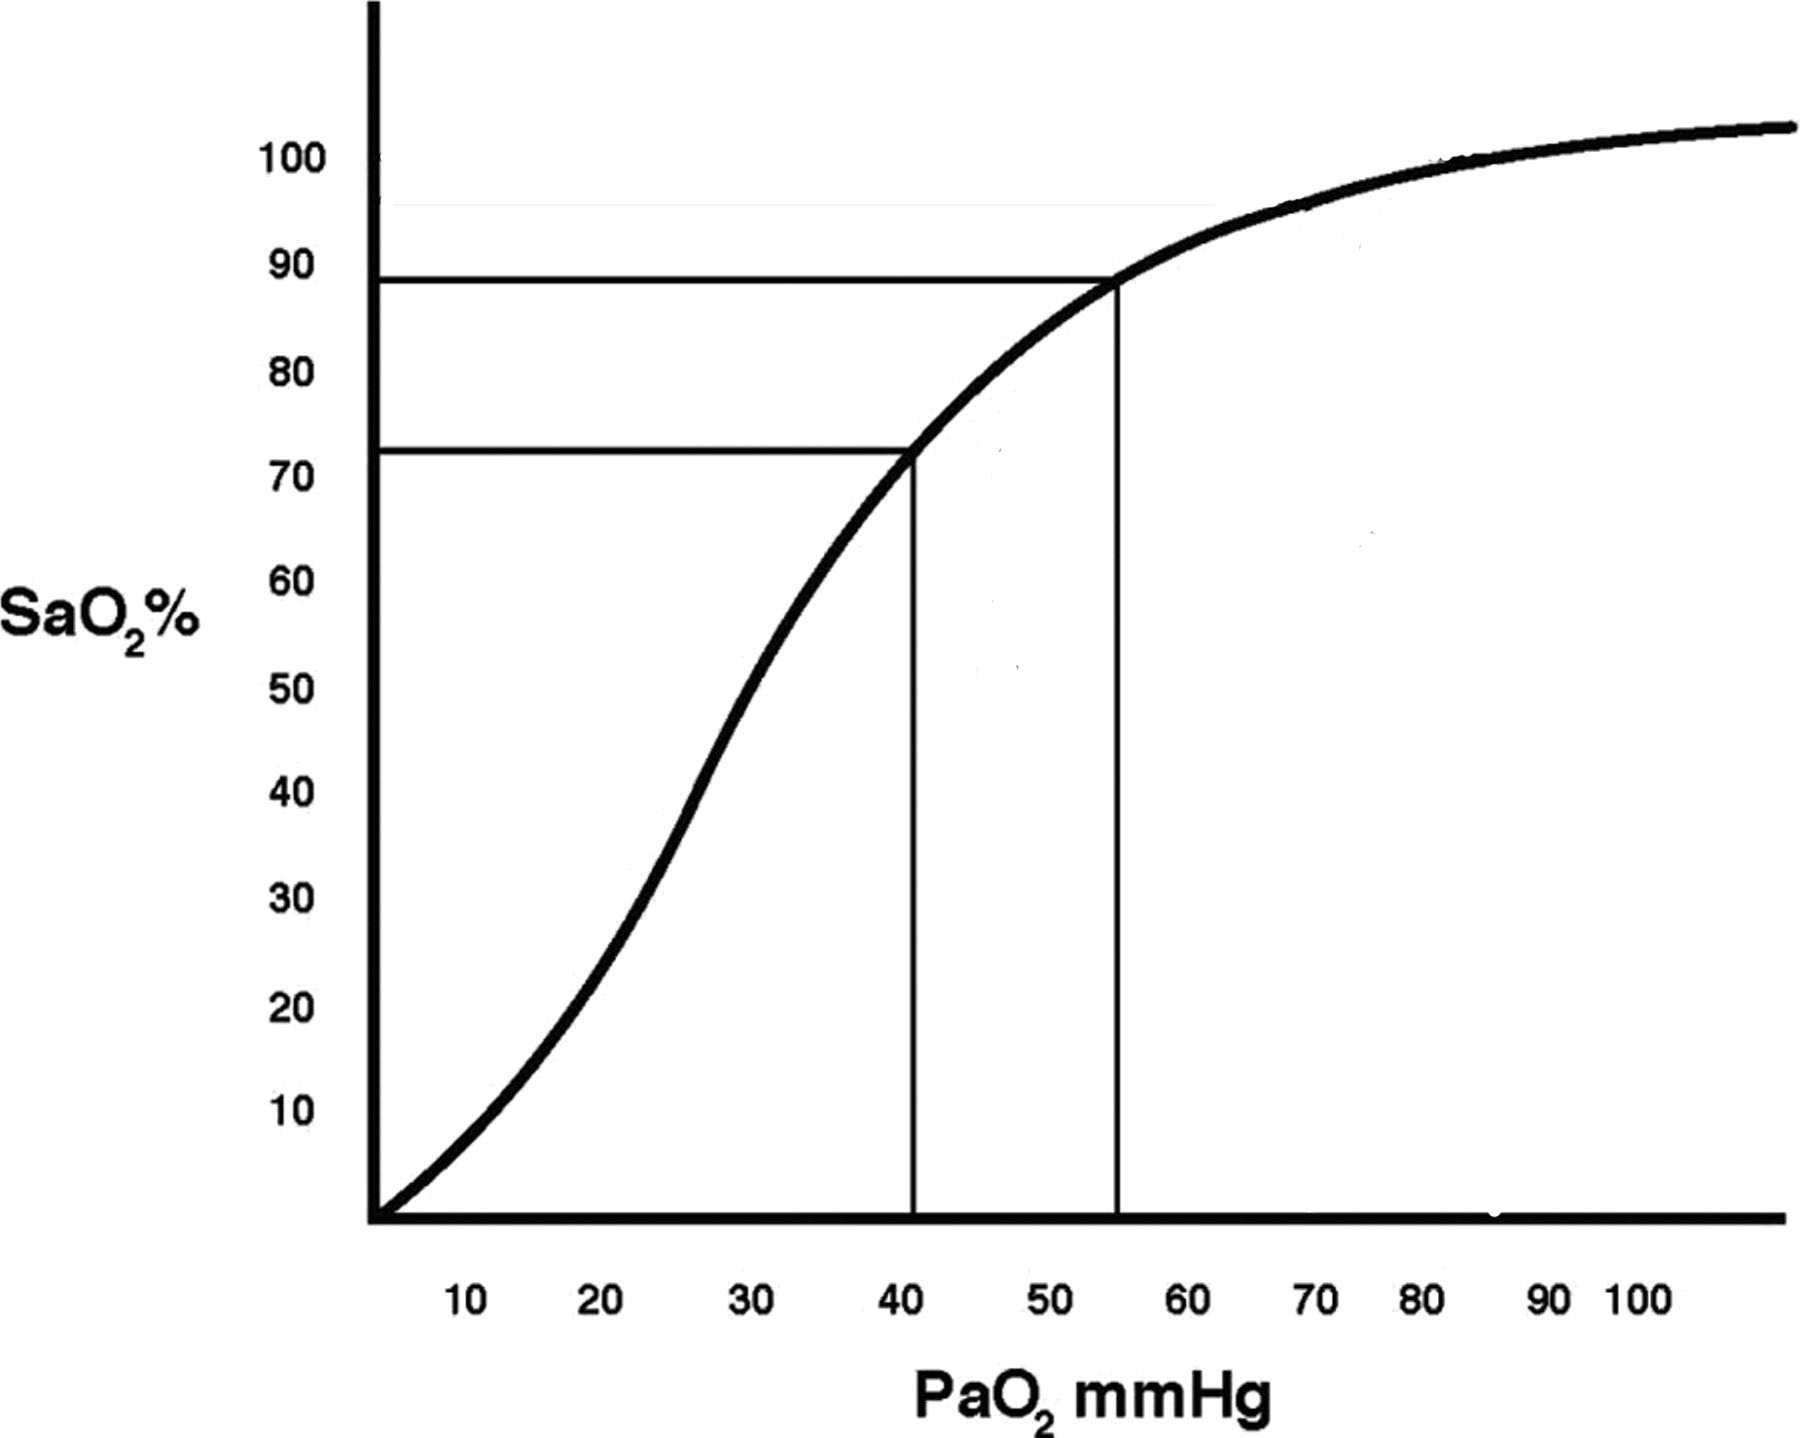
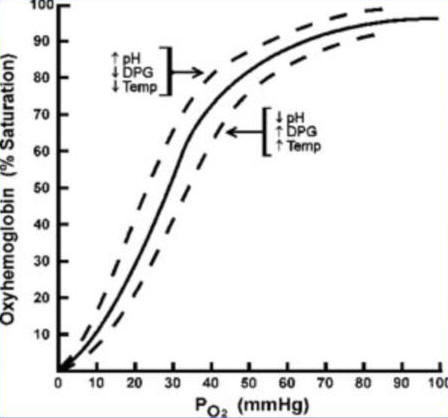
Hemoglobin Saturation Curve
shift to the right is right (good) i.e. more O2 released to cells

Oxygen Transport
the first equation you need is the
Oxygen carrying capacity of blood
CaO2=(Hb) x 1.38 x SaO2 + (0.003 x PaO2)
1.38 is the carrying capacity of a gram of Hb
normally 17-20 cc/dL
Note that >99% of the capacity is from Hb binding
Oxygen Delivery to Tissues
DO2=CaO2 cc/dL x (CO L/min) x 10
10 is the conversion factor to convert L to dL
normally 950-1150 cc/min
DO2I=CaO2 x CI x 10
normally 550-650 cc/min/m2
Oxygen Consumption by Tissues
Fick Equation
VO2=(CaO2-CvO2) x CO x 10 or
VO2=1.38 (Hb)(CO)(SaO2-SvO2)/10
normally 240-290 cc/min
VO2=oxygen consumed
DO2=Oxygen delivered
VO2/DO2 is normally 0.22-0.27 (0.25)
Rising VO2/DO2 ratio is a sign of inadequate tissue oxygenation
CvO2=(Hb) x 1.34 x SvO2 + 0.003 x PvO2
Normally 15 cc/dl
VO2I=(CaO2-CvO2) x CI x 10
Normally 115-165 cc/min/m2
PvO2 of 28 is required to cause oxygen to diffuse into cells, below this point anaerobic metabolism occurs. This is equivalent to an SvO2 of 50% unless the oxyhemoglobin curve is shifted.
vasoregulation is an important factor that can not be measured.
Cirrhosis and sepsis look hemodynamically identical
capillary shunt
blood flowing past unventilated alveoli
atelectasis
pneumonia
ards
pulmonary edema
anatomic shunt
positive pressure may worsen
overventilation compresses blood vessels leading to increasing shunt and increasing deadspace
Ve=minute volume
Ve=Vd + Va
we compensate by increasing CO and increasing oxygen extraction
we can decrease extraction ratio to get venous sat of 40%
we can easily triple CO or up to 20 L/min
Is oxygen delivery adequate for the patient’s needs?
Measured
PaO2
PaCO2
SaO2 or SpO2
SvO2 (Mixed Venous)
Venous Oxygen Tension PvO2
Hb
CO
Calculated
Pulmonary Capillary O2 Content (CcO2)
Arterial Oxygen Content (CaO2)
Venous Oxygen Conent (CvO2)
Arterial-venous oxygen content difference (Ca-vO2)
Oxygen utilization coefficient (OUC)
Oxygen Delivery Index (DO2I)
Oxygen Consumption Index (VO2I)
Intrapulmonary Shunt (Qsp/Qt)
Cardiac Index (CI)
Oxygen content=oxygen bound to Hb + oxygen dissolved in plasma
Oxygen bound=Hgb concentration x (1.34 cc oxygen per g Hb) x saturation of Hb
Oxygen dissolved=blood oxygen tension x (0.0031 solubility coefficient of oxygen in blood)
![]()
CcO2 = pulmonary end-capillary oxygen content
= oxygen bound to Hgb as it leaves the alveolus
= (1.34 x Hgb x 1.0) + (PAO2 x 0.0031)
The saturation of oxygen in the pulmonary end-capillary should be 1.0 if FiO2 > 0.21 PAO2 = alveolar oxygen tension = FiO2 x [(PB-PH20)-(PaCO2/RQ)] PB = barometric pressure, PH2O = water vapor pressure, RQ = respiratory quotient = 0.40 x [(760 torr – 47 torr) – (40 torr/0.8) (assuming normal values) = 0.40 x 663 torr = 265 torr PAO2 can also be approximated rapidly at the bedside as 700 torr x FiO2 – 50 torr = 20.1 ml O2/dl blood + 0.8 ml O2/dl blood (assuming normal values) = 20.9 ml O2/dl blood
CaO2 = arterial oxygen content = arterial oxygen content as blood leaves the heart = oxygen bound to Hgb in arterial blood (98 %) + oxygen dissolved in arterial plasma (2%) = (1.34 x Hgb x SaO2) + (PaO2 x 0.0031) 1.34 mL of oxygen can be carried on each gram of human hemoglobin; this number varies from species to species = (1.34 x 15 g x 1.0) + (100 torr x 0.0031) (assuming normal values) = 20.1 ml O2/dl blood + 0.31 ml O2/dl blood = 20.4 ml O2/dl blood
CvO2 = venous oxygen content = venous oxygen content as blood returns to the heart = oxygen bound to Hgb in venous blood (>99%) + oxygen dissolved in venous plasma (<1%) = (1.34 x Hgb x SvO2) + (PvO2 x 0.0031) PvO2 can be measured with a venous blood gas, or estimated as 35 torr with high accuracy = (1.34 x 15 g x 0.75) + (35 torr x 0.0031) (assuming normal mixed venous oxygen saturations) = 15.1 ml O2/dl blood + 0.11 ml O2/dl blood = 15.2 ml O2/dl blood
Ca-vO2 = arterial-venous oxygen content difference = CaO2 – CvO2 = 20.4 ml O2/dl blood – 15.2 ml O2/dl blood = 5.2 ml O2/dl blood
Once the oxygen contents throughout the vascular circuit have been calculated, the amount of oxygen delivered to the tissues (oxygen delivery index or DO2I) and the amount of oxygen consumed by the tissues (oxygen consumption index or VO2I) can be calculated. DO2I = oxygen delivery index = volume of gaseous O2 pumped from the left ventricle per minute per meter squared BSA = CI x CaO2 x 10 dL/L (the 10 dL/L corrects for the fact that CI is measured in L/min/m2 and oxygen content is measured in ml/dl) = ~600 ml O2/min.m2 VO2I = oxygen consumption index = volume of gaseous O2 consumed by the body per minute per meter squared BSA = volume of oxygen leaving the heart – volume of oxygen returning to the heart = [(CI x CaO2) – (CI x CvO2)] x 10dL/L = CI x Ca-vO2 x 10 dL/L = ~150 ml O2/min.m2 Two oxygenation parameters characterize the relative balance between oxygen delivery and oxygen consumption (supply versus demand): the oxygen utilization coefficient (OUC) and the mixed venous oxygen saturation (SvO2). The OUC, also known as the oxygen extraction ratio or O2ER, is the percentage of delivered oxygen which is consumed by the body and is calculated as follows: OUC = Oxygen utilization coefficient = VO2I / DO2I = ~0.25 If the SaO2 is maintained at a relatively high level (> 0.92), the OUC can be approximated as: = 1- SvO2

MIXED VENOUS OXIMETRY The SvO2, by providing a continuous online indication of the relative balance between VO2I and DO2I, can be used:
1) as an “early warning signal” to detect the onset of oxygen transport imbalance before clinical deterioration occurs
2) to evaluate the efficacy of therapeutic interventions such that physiologic end-points are reached more quickly
3) to identify potentially detrimental consequences of patient care (suctioning, positioning, etc.) that might otherwise go unnoticed It is essential to remember that the SvO2 is a “flow-weighted average” of the venous saturations from all perfused vascular beds. Thus, the SvO2 does not reflect the oxygen transport adequacy of non-perfused vascular beds nor does a normal SvO2 mean that all tissues are adequately oxygenated. It is only an average estimate of venous saturation for the whole body. It provides an impression of the overall balance between VO2I and DO2I, but does not yield information about the adequacy of perfusion of any individual vascular bed. If the SvO2 falls, VO2I is increasing (and may lead to anaerobic metabolism if DO2I is not sufficient) or DO2I is decreasing. If the SvO2 increases, VO2I is decreasing, DO2I is increasing, blood is being shunted pass vascular beds without releasing its oxygen (such as in sepsis or cirrhosis), or oxygen uptake by the tissues is decreased. There are four determinants of SvO2: Hgb, cardiac output, SaO2, and VO2I.
There are thus four main causes of low SvO2:
1) anemia,
2) low cardiac output,
3) arterial desaturation
4) increased VO2I.
In the presence of low SvO2, changes in these four parameters should be investigated. There are two common sources of error in venous oximetry measurements. The use of continuous venous oximetry relies on reflectance spectrophotometry technology. If the catheter is not properly calibrated via either an in vitro calibration prior to catheter insertion or an in vivo calibration via a mixed venous blood gas, the SvO2 values obtained may not accurately reflect the true oxygen transport balance. Careful attention should be given to catheter calibration to prevent such errors. The second source of error is catheter malposition. If the catheter tip is against the wall of the pulmonary artery, the light reflected back to the catheter will be amplified artificially increasing the SvO2 measurement. Proper catheter positioning is essential to obtaining reliable SvO2 values. Thus, SvO2, although not a specific indicator of the cause of hemodynamic and oxygen transport compromise, is a sensitive online monitor of the adequacy of balance between oxygen delivery and oxygen consumption accurately predicting potentially detrimental changes in patient status before they become clinically apparent. This allows appropriate therapeutic interventions to be initiated prior to the development of severe changes in a patients cardiorespiratory status.
FUNDAMENTAL QUESTIONS TO BE ANSWERED IN EVALUATING OXYGEN TRANSPORT
1) Is DO2I adequate for the patient’s needs?
DO2I should be at least 10mL/kg/min
If inadequate, check the OUC; it should not exceed 0.35 as this suggests that oxygen supply is barely meeting oxygen demand
Remember that SvO2 ≅ 1-OUC (for SaO2 > 0.92); this can be used as a rough approximation in assessing the adequacy of oxygen transport balance
Ensure that the patients hemoglobin is appropriate for their degree of shock; consider transfusion of packed red blood cells if DO2I is inadequate When oxygen delivery (DO2I) exceeds oxygen demand, oxygen consumption will plateau and will no longer rise as oxygen delivery increases (Figure 3). This balance where DO2I meets the cellular needs of the body should be the goal in critical care. At the point where DO2I no longer meets oxygen demand (the so called critical DO2), oxygen consumption becomes supply dependent.
In this region of supply dependency, increases in DO2I result in increases in VO2I indicating that the bodys oxygen demands were not previously being met. DO2IVO2I”Supply Dependency””Critical DO2″ Figure 3:
Oxygen Supply Dependency One of the most important determinants of tissue oxygen delivery is the arterial hemoglobin concentration. While oxygen delivery from the left ventricle is linearly related to the hemoglobin concentration, capillary flow may be impaired at extremely high hematocrits. The optimal hemoglobin concentration to maximize tissue oxygen delivery seems to be in the range of between 10 and 13 grams per deciliter. Whether or not transfusion to achieve these high hemoglobin levels improves outcome remains to be proven. Since loading oxygen on to the hemoglobin molecules is rarely a significant problem, attention must be turned to factors which will help unload oxygen from the hemoglobin at the tissue level. Judicious amounts of acidemia, hypercarbia, and fever all produce a right shift in the oxyhemoglobin association curve and may improve tissue unloading of oxygen (Figure 4). Figure 4: Oxyhemoglobin Dissociation Curve
2) Is cardiac output adequate for oxygen consumption?
Check the Ca-vO2