Pulmonary Artery Catheters
” a fool with a tool is still a fool.”
Primer on PAC pressure interpretations: http://intensiveblog.com/puzzling-pac-pressures/
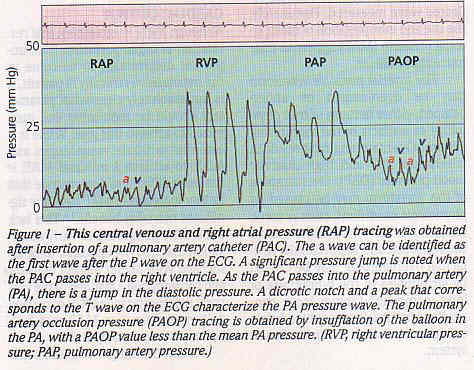
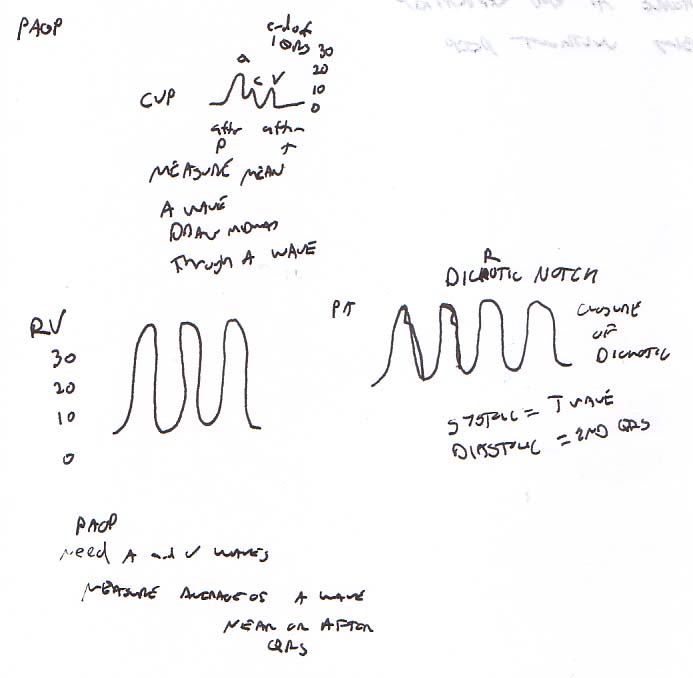
The reference range for PA pressure values is:
- RAP = 0-6 mmHg
- RV = 25/0 mmHg
- PAP = 15-30/5-15 mmHg
- PAOP = 2-10 mmHg
Pulmonary Artery Catheter Insertion
put hand on patient’s chest to feel rather than see respirations

(From SCCM Site) Evidence is the foundation of best practice and essential reading as part of any PAC training/course should include:
1. Robin ED. The Cult of the Swan-Ganz Catheter: Overuse and Abuse of Pulmonary Flow Catheters. Ann Intern Med. 1985;103(3):445-449. doi:10.7326/0003-4819-103-3-445
2. Shah MR, Hasselblad V, Stevenson LW, Binanay C, O’Connor CM, Sopko G, Califf RM. Impacts of the Pulmonary Artery Catheter in Critically Ill Patients: Meta-analysis of Randomized Trials. J Am Med Ass 2005;294:1664-1670.
3. Stevenson LW and the ESCAPE investigators and ESCAPE coordinators. Evaluation Study of Congestive Heart Failure and Pulmonary Artery Catheterization Effectiveness. J Am Med Ass 2005;294:1625-1633.
4. Phillips RA, Hood SG, Jacobson BM, West MJ, Wan L, May CN. Pulmonary artery catheter (PAC) accuracy and efficacy compared with flow probe and transcutaneous Doppler (USCOM): An ovine validation. Crit Care Res Prac 2012; doi:10.1155/2012/621496
Assumptions:
CVP doesn’t usually equate with with LAP
LAP does equate with PAOP if there is no mitral stenosis, no atrial regurg and a patent pulmonary vascular bed (bed distal to the catheter has to be filled with blood.
PAWP is accurate if in a Zone III area of the lung where Pa>Pv>PA(lveoli)
On X-ray, should be no more than 3-5 cm across the midline
Consider a lateral chest x-ra to make sure the cath is below the level of the left atrium (zone III)
Wedge pressure should always be less than Pulm Diastolic Pressure except in mitral regurg
Table 2 The length of insertion of PA catheter (cm) to reach various chambers. RV, right ventricle; PA, pulmonary artery; PCWP, pulmonary capillary wedge pressure Mean (SD) (range) 95% CIs RV (n=300) 24.6 (3.0) (22.542) 24.224.9 PA (n=298) 36.0 (4.0) (27.555.5) 35.636.5 PCWP (n=278) 42.8 (5.7) (36.170) 42.243.5 RV to PA (n=298) 11.33 (3.36) 10.9511.71 PA to PCWP (n= 278) 7.37 (3.81) 6.947.8 The consultant or a senior resident doctor under supervision performed all the catheterizations. A central approach for the cannulation of right internal jugular vein (IJV) was used inall patients.5 The needle was inserted at the apex of the triangleformed by medial and lateral heads of sternocleidomastoid muscleand the clavicle. An 8.5 F introducer sheath (Edwards LifesciencesIntroflex, CA, USA) was inserted using Seldinger technique.The PA catheter was inserted through the introducer sheath afterflushing all the lumens. The distal lumen was transduced toobtain a waveform on the monitor (Datex AS3 Ohmeda Engstrom,Helsinki, Finland). The catheter was initially inserted up to20 cm and the balloon was inflated with 1.5 ml of air. The catheterwas then advanced slowly (approximately 1 cm each time) whilewatching the waveform on the monitor. At the first appearanceof characteristic RV, PA and PCWP waveforms, the length of catheterthat was inserted was measured with the help of a scale andthe marks present on the PA catheter. For example, if 40 cmmark was visible nearest to the point of insertion, the distancebetween this mark and the last visible part of PA catheter wasmeasured and subtracted from 40 cm. In addition, the lengthof the hub of the sheath was measured, which is equivalent tothe distance from skin to the last visible part of the PA catheter.This distance was 4 cm and was constant for all patients. Therefore,4 cm was further subtracted from the earlier value to give thelength of insertion from skin. The length of insertion requiredto reach RV, PA or PCWP was recorded in each patient. In addition,the distance to reach PA from RV and PCWP from PA were calculatedby subtracting RV from PA and PA from PCWP, respectively. Onreaching the wedge position, the balloon was deflated and thePA catheter was fixed in this position. A postoperative X-raychest was checked in all patients to rule out coiling of thecatheter. (BJA August 2006)Table 3The average length of insertion to reach different chambers in patients undergoing CABG and valve replacement surgeries. RV, right ventricle; PA, pulmonary artery; PCWP, pulmonary capillary wedge pressure; CABG, coronary artery bypass surgery
Type of surgery Mean (SD) P-valueRV Valve replacement 26.0 (3.8) <0.001 CABG 24.0 (2.5) PA Valve replacement 38.5 (4.6) <0.001 CABG 35.0 (3.2) PCWP Valve replacement 47.8 (6.9) <0.001 CABG 41.2 (4.1)
when you wedge, svO2 will go up, may even match arterial.
SvO2 is not mixed venous when the balloon is up.
Catheters are not beneficial in morbidity/mortality for surgical or medical patients (NEJM 2003 Jan 2 348:5-14, JAMA 2003 Nov 26 290:2713) but they did not increase mortality either.
PAC-Man shows no clear benefit or harm to PA Caths (Lancet 2005;366:472)
If you are placing a femoral PAC in a chronic patient, get an abdominal film to assure there has been no previous placement of an IVC filter.
Escape Trial
Therapy to reduce volume overload during hospitalization for heart failure led to marked improvement in signs and symptoms of elevated filling pressures with or without the PAC. Addition of the PAC to careful clinical assessment increased anticipated adverse events, but did not affect overall mortality and hospitalization. Future trials should test noninvasive assessments with specific treatment strategies that could be used to better tailor therapy for both survival time and survival quality as valued by patients. (JAMA. 2005;294(13):1625-1633.)
The articles that started all the craze by Swan (NEJM Dec 9, 1976)
Tricuspid regurg, tamponade and right ventric fx all cause elevated RAP/CVP
tricuspid regurg should be detected by large V waves
retrospective study shows mortaility benefit in sick and old trauma patients managed with a PAC (Crit Care Med 2006;34(6):1597)
THe final nail from NEJM and ARDSnet
increased complications, no motality benefit (NEJM 2006;354(21):2213)
Archives of Surgery Vol. 123 No. 8, August 1988 Archives Pulmonary artery diastolic and wedge pressure relationships in critically ill and injured patients R. F. Wilson, S. B. Beckman, J. G. Tyburski and D. J. Scholten Department of Surgery, Detroit Receiving Hospital, Mich. To study pulmonary artery wedge pressure (PAWP) and pulmonary artery diastolic pressure (PADP) relationships, we measured these simultaneously with cardiac outputs 1922 times in 128 patients who were critically ill or in an intensive care unit. In 356 (18.5%) of the readings, the PAWP exceeded the PADP, indicating that the PAWP reading might be erroneous. In 106 (5.5%) of these readings, the PAWP was 6.0 mm Hg or more higher than the PADP, indicating that the PAWP was almost certainly erroneous. In virtually all instances in which this discrepancy was recognized, changing the position of the catheter tip provided a PAWP value equal to or lower than the PADP. On the other extreme, in 49 (30%) of the patients, the PADP was 6.0 mm Hg or more higher than the PAWP. The pulmonary vascular resistance in these patients averaged (+/- SD) 257 +/- 145 dyne/s/cm-5 (normal, 80 to 160 dyne/s/cm-5). The mean pulmonary vascular resistance in the other 74 patients was significantly lower (158 +/- 72 dyne/s/cm-5). The mortality rate with the increased PADP-PAWP gradients was 59% (24/49). This was significantly higher than the mortality rate (34%, or 27/79) seen with lower PAWP-PADP gradients. Thus, the relationship between the PADP and PAWP should be examined closely in critically ill patients. A PAWP higher than the PADP indicates that the PAWP measurement may be erroneous. On the other hand, if the PADP exceeds the PAWP by 6.0 mm Hg or more, the patient has probably developed pulmonary hypertension and has a much poorer prognosis.
RVEDV Swans
Need volumetric data
RVEF=right ventricular ejection fraction
RVEDI=right ventricular end-diastolic volume index
Independent of zero-pressure references and changing compliance
Proof cheathem et al. 2000
RVEDI=CI / (HR RVEF) or = SVI/RVEF
Incorrect placement, mitral valve disease, or irregular heart rate can still screw up the measurements
RVEDI reflects preload status
RVEF reflects contractility and afterload
RVEF
Normal Pt
Crit Ill Pt
.2
200
240
.3
150
180
.35
125
150
.4
100
120
.5
50
60
FACTT Trial
by ARDSnet folks
The FACTT Study
Because available data are inconclusive in supporting either a fluid-liberal or a fluid-conservative approach and are also inconclusive regarding the clinical value and risks of a PAC vs a CVC in ALI/ARDS, the National Institutes of Health (NIH) ARDS Network launched the FACTT study (Fluid and Catheter Therapy Trial). The NIH ARDS Network was uniquely suited to perform such a trial. Organized in 1994 by the National Heart, Lung, and Blood Institute (NHLBI), the Network had proven successful at conducting several previous large multicenter trials examining management practices and therapies for ALI/ARDS. For FACTT, 20 academic centers were involved across North America.[2-4]
FACTT ultimately enrolled 1000 ALI/ARDS patients and randomized them to 1 of 4 treatment strategies for 7 days. The primary end point was mortality at 60 days. Secondary end points included the number of ventilator-free days and organ-failure-free days and parameters of lung physiology. The 4 strategies were:
- Fluid-conservative/CVC: fluids were restricted and diuretics administered to maintain a CVP < 4 mm Hg;
- Fluid-conservative/PAC: fluids were restricted and diuretics administered to maintain a PAOP < 8 mm Hg;
- Fluid-liberal/CVC: fluids were used to maintain a CVP between 10 and 14 mm Hg; and
- Fluid-liberal/PAC: fluids were used to maintain a PAOP between 14 and 18 mm Hg.
In all 4 groups, explicit rules guided fluid administration, diuretics, and dobutamine usage. In addition to the CVP and PAOP targets above, other parameters that specifically guided fluid therapy were urine output (target > 0.5 mL/kg/hr), blood pressure (target of 60 mm Hg for the mean arterial pressure), and “tissue perfusion” (target cardiac index in the PAC group > 2.5 L/min/kg, targets in the CVC group included capillary refill and other physical signs). If a shock state developed (mean arterial pressure < 60 mm Hg or the need for pressors), clinicians were permitted to use whatever fluids and other therapies felt appropriate. All patients were also managed on the NIH ARDS Network low tidal volume strategy.
Results
The study concluded in late 2005. The results were released May 21, 2006, and presented at that time at the annual American Thoracic Society meeting in San Diego. They were published in The New England Journal of Medicine in the early summer of 2006. (The CVC vs PAC results were published in the May 25 issue, and the fluid-liberal vs fluid-conservative results were published in the June 15 issue.) Some of the important findings are:
One thousand patients were enrolled and randomized in the trial. The average age was 49.8 years, 53% were female, and 64% were white. The average APACHE III was 94.1, and 66% were medical ICU patients. The primary cause for lung injury was pneumonia (47%), followed by sepsis (25%) and aspiration (14%). The 4 study groups were well matched for race, comorbidities, and types of lung injury. The prerandomization fluid balance data showed that these patients were already fluid positive (mean total fluid balance was +2700 mL, mean CVP was 12.1 mm Hg, and mean PAOP was 15.6 mm Hg).
There were no differences in important outcomes in patients with PAC monitoring vs patients with CVC monitoring. However, patients with PAC monitoring had twice as many complications related to catheters compared with those with CVC monitoring (primarily nonlethal cardiac dysrhythmias). Of note, PAC was associated with significantly more blood transfusions (38% vs 30%) and a slight increase in ICU stay (0.22 days). The investigators concluded that “the use of the PAC is not indicated in the routine management of ALI/ARDS but this study does not address unusually complex patients nor the diagnostic uses of the PAC in ALI/ARDS.”
Fluid Strategy
Because catheter use had no influence on results, the data from the CVC and the PAC patients in both fluid categories are combined (n = 503 in the conservative fluid group, n = 497 in the liberal fluid group) in the following discussion. Not surprisingly, the conservative fluid strategy required more than twice as much diuretic administration as the liberal fluid strategy. This resulted in a nearly even fluid balance over the 7 study days in the conservative group while the liberal fluid strategy resulted in a positive fluid balance of almost 1 L per day. Specifically, cumulative fluid balance over the first 7 days was -136 ± 491 mL in the conservative group vs 6992 ± 502 mL in the liberal group (mean ± SEM; P < .0001). Of note, this fluid-liberal result was remarkably similar to the fluid balances seen in previous NIH ARDS Network trials where fluid management was not controlled.[2,3] This suggests that the fluid-liberal strategy likely represents “usual” clinical practice.
Mortality was not affected by fluid strategy. Specifically, 60-day mortality was 25.5% in the conservative group vs 28.4% in the liberal group (P = .3005; 95% confidence interval for the difference -2.6 to +8.4). The conservative strategy was associated with significant improvement in lung function. Specifically, this strategy improved the oxygenation index and Lung Injury Score, lowered plateau airway pressure, and increased the number of ventilator-free days (14.6 ± 0.5 vs 12.1 ± 0.5; P = .0002) and ICU-free days (13.4 ± 0.4 vs 11.2 ± 0.4; P = .0003) to day 28. These improvements were also associated with a small but significantly lower positive end-expiratory pressure requirement in the conservative fluid group.
The conservative strategy was associated with a small but significant reduction in cardiac index (primarily from a reduced stroke volume) and mean arterial pressure. This, however, did not result in a difference in mixed venous oxygenation or an increased incidence of shock. The conservative strategy was also associated with a small but significant increase in creatinine, blood urea nitrogen, and bicarbonate, but this was not associated with an increase in the incidence or prevalence of renal failure or the use of dialysis to day 60 (10% of conservative group vs 14% of liberal group; P = .0642). Indeed, the only significant difference in organ failure days was a slight reduction in central nervous system failure days in the conservative fluid group. The hemoglobin concentration was slightly increased in the conservative fluid group, but fewer patients receiving the conservative strategy were transfused (39% vs 29%).
Conclusions
The investigators concluded that “although the study did not detect a difference in mortality, the conservative fluid strategy improved lung function and shortened the duration of mechanical ventilation and intensive care stay, without increasing nonpulmonary organ failures. These results support the use of a conservative fluid management strategy in ALI/ARDS patients.” In a news release from the NHLBI with the headline “For Patients With Severe Lung Injury; Less Is More,” Gordon Bernard, MD, Professor of Medicine at Vanderbilt and Chair of the NIH ARDS Network Steering Committee, went on to say: “Fluid management is a complex issue, and, until now, it was not clear whether providing more or less fluids was more beneficial. Current trends in usual care appear to more closely resemble the liberal fluid management arm of this study — the study arm with worse outcomes. This suggests that changing usual practice and adapting more conservative fluid management would better serve ALI and ARDS patients.”[4]
References
- Connors AF, Speroff T, Dawson NV, et al. The effectiveness of right heart catheterization in the initial care of critically ill patients. SUPPORT Investigators. JAMA. 1996;276:889-897. Abstract
- NIH ARDS Network. Ventilation with lower tidal volumes as compared to traditional tidal volumes in acute lung injury and acute respiratory distress syndrome. N Engl J Med. 2000;342:1301-1308. Abstract
- NIH ARDS Network. Higher versus lower PEEP in patients with ARDS. N Engl J Med. 2004;351:327-336. Abstract
- NIH News Release: the FACTT Trial: May 21, 2006. Available at: http://www.nhlbi.nih.gov/new/press/06-05-22.htm. Accessed July 6, 2006.
sub-analysis of FACCT states physical exam not adequate for CO determination. But it actually shows that cool extremities do correlate (Crit Care Med 2009 37:2720)